I have recently studied data visualization with D3.js and React from Datavis 2020 by Curran Kelleher.
Here is a demo page I deployed the outcomes: takuti-sandbox.github.io/datavis-2020 [repo]
What Datavis 2020 introduces
Overall, the course was just AMAZING and does teach us a wide variety of essential knowledge, including not only basic usage of D3.js but advanced performance optimization techniques:
- Key concepts in data visualization e.g., types of data and chart, starting from a hand-writing sketch and communicating with stakeholders
- Git basics
- Tracking license and source of a public dataset
- React and ES6 basics
- Creating modules
- Performance optimization by memoization
That is, I believe the video series is also beneficial as an 101 course for programming and software engineering.
As Curran referred in a video, Datavis 2020 follows the following principle:
Make it work, make it right, make it fast. — Kent Beck
One thing I like about the course is how the contents are well-structured from the basics to advanced topics in this particular order.
What the course doesn't cover, on the other hand, is about production-grade package management tools and transpilers in a modern JavaScript ecosystem. It makes a lot of sense as there are so many options in this field and the trends change so rapidly; we can easily lose sight of our goal if we dive deep into those details.
By using an online coding platform, VizHub, which internally uses rollup.js and buble (not "Babel"), the course nicely simplified such a complex process of installation, dependency management, and compilation.
It's modern
The practical courses of Datavis 2020 did a great job of updating my out-of-date knowledge and learning something new.
Historically, "Interactive Data Visualization for the Web: An Introduction to Designing with D3" was one of the most popular guides to D3.js data visualization as far as I observed:

However, its 2nd edition relying on D3 v4 is already outdated since v5 has been released1, and the book is too basic for experienced developers.
Meanwhile, if I remember correctly, my last in-depth D3 experience was its v3, which is 3 major versions older than the latest, and I used the library with Leaflet and jQuery for geospatial data visualization. jQuery...it's so nostalgic, isn't it?
By contrast, Datavis 2020 is a valuable guide to modern JavaScript & D3.js that relies on React.
What's next?
As I wrote in "What Makes a Good Dashboard: The Rise of Augmented Analytics", I'm currently interested in the possibility of visualization as a tool for effective use of data and machine learning. Thus, by leveraging what I learned from Datavis 2020, I'd like to build an interactive dashboard that brings a clear value to our life.
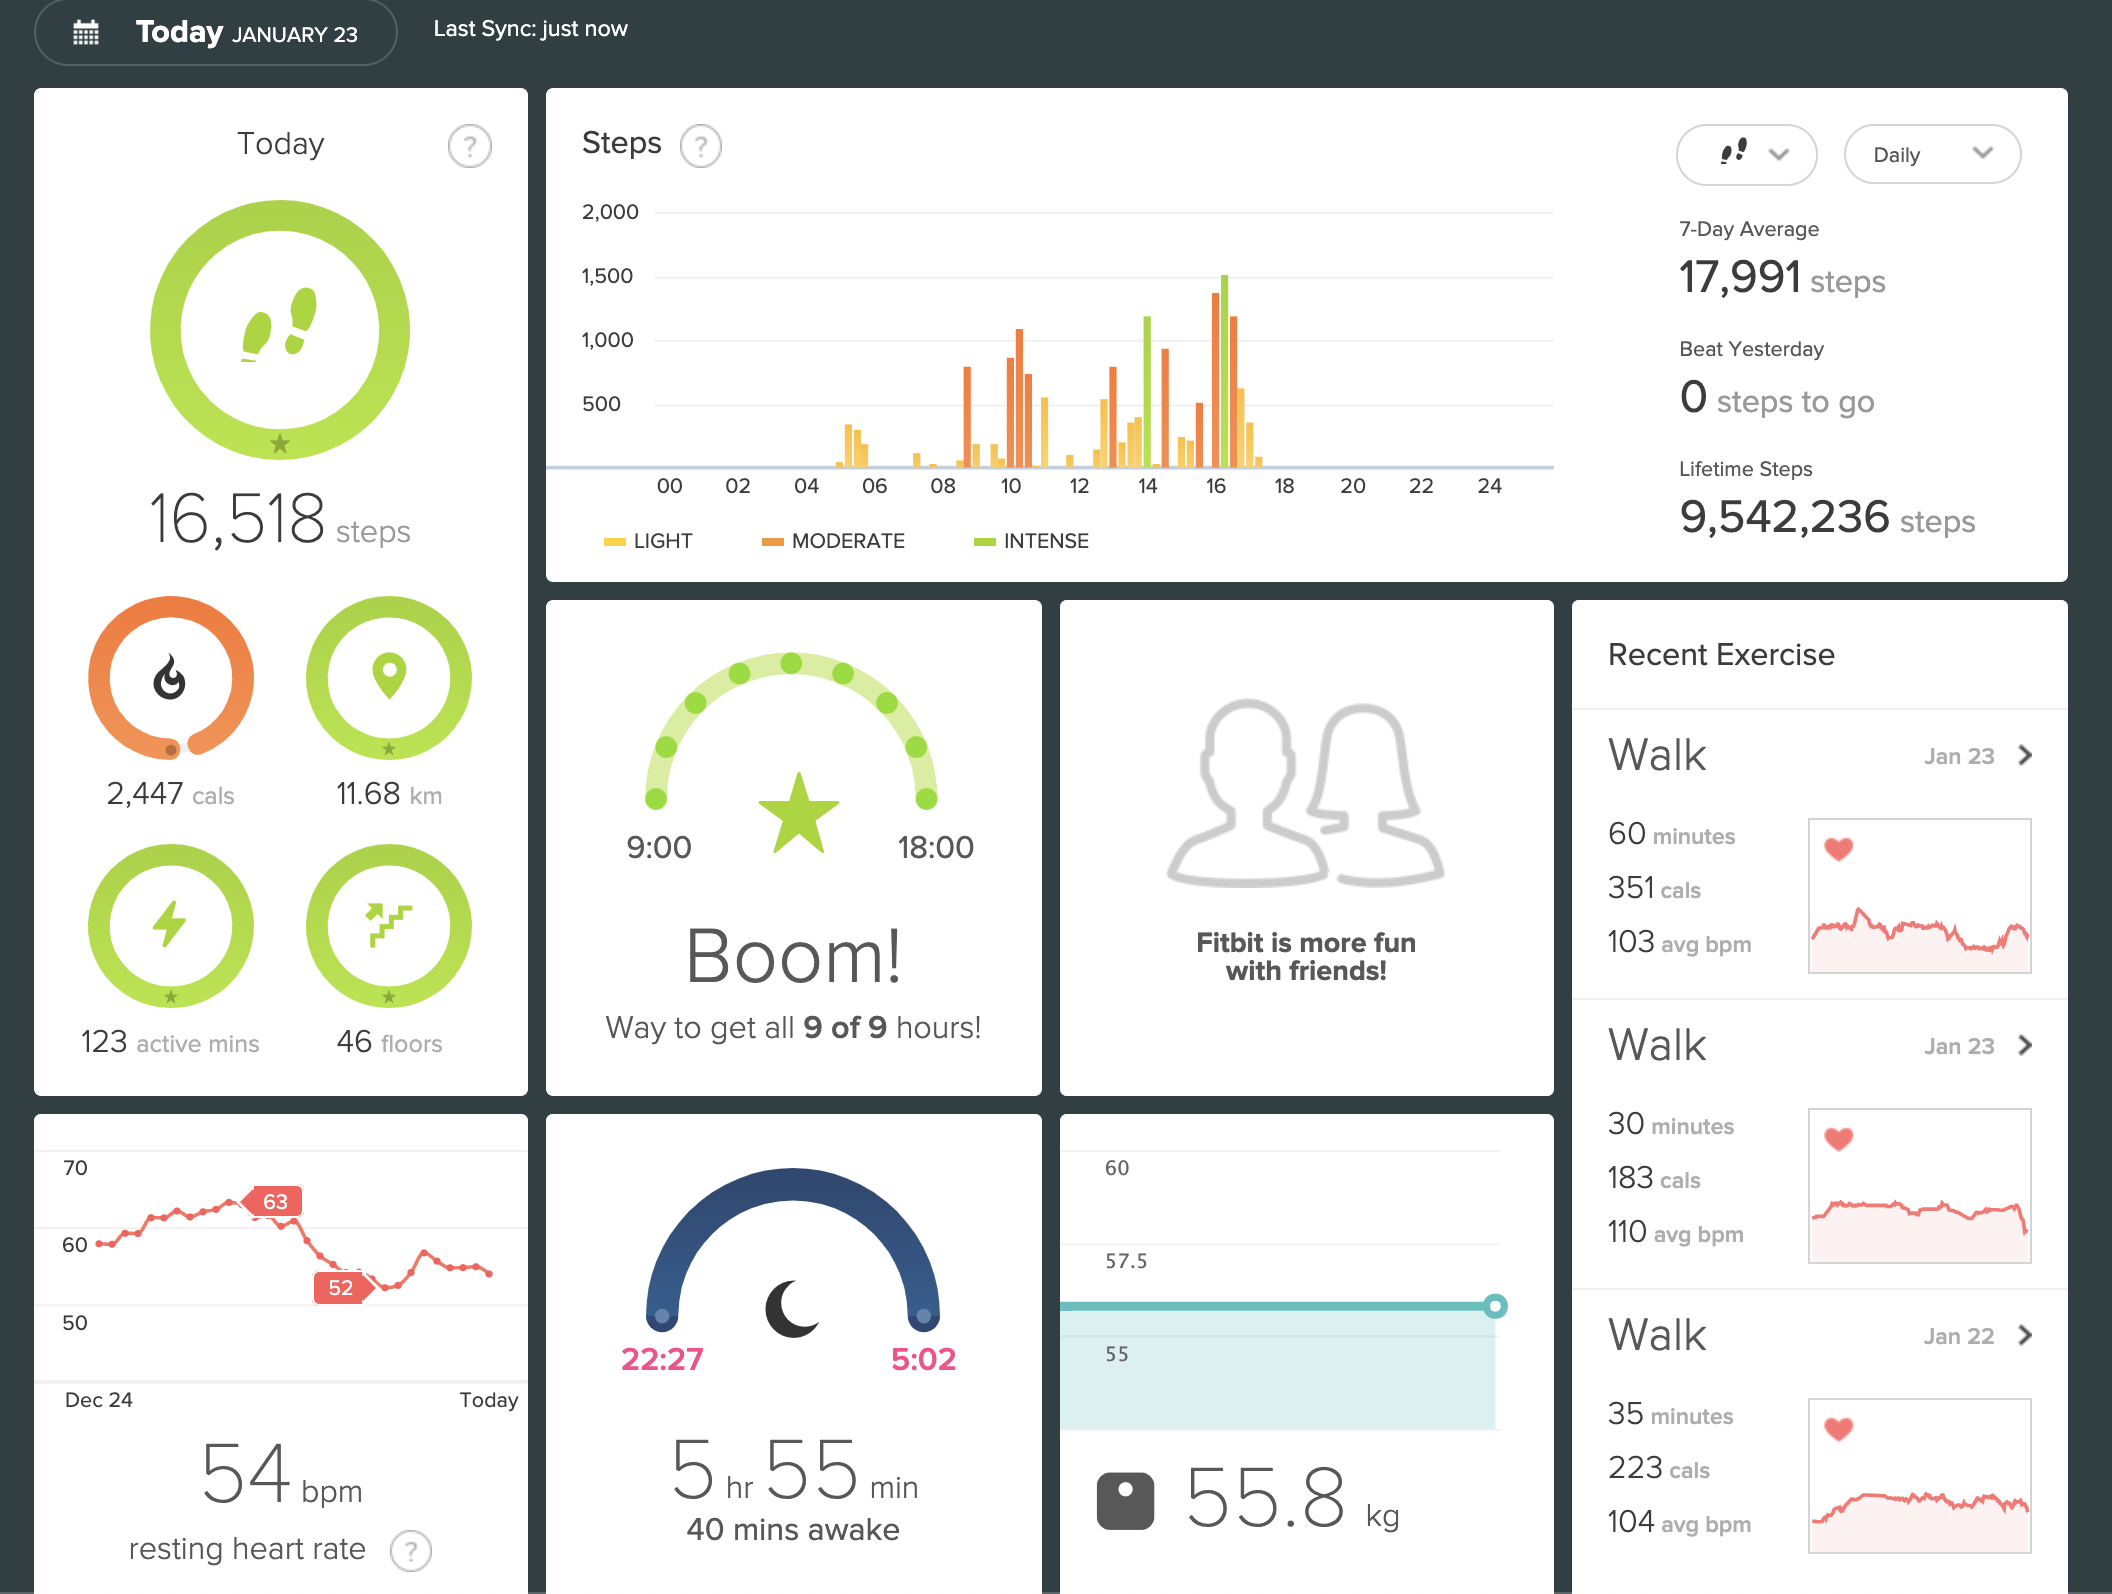
To be more precise, I'm trying to explorer my health and activity log collected by Fitbit.
They do expose an official dashboard on their website, but I don't see any actionable insights on the top; it's far from how Augmented Analytics should be.
As a first step, I just started looking into Fitbit API and creating a simple bar chart from there:
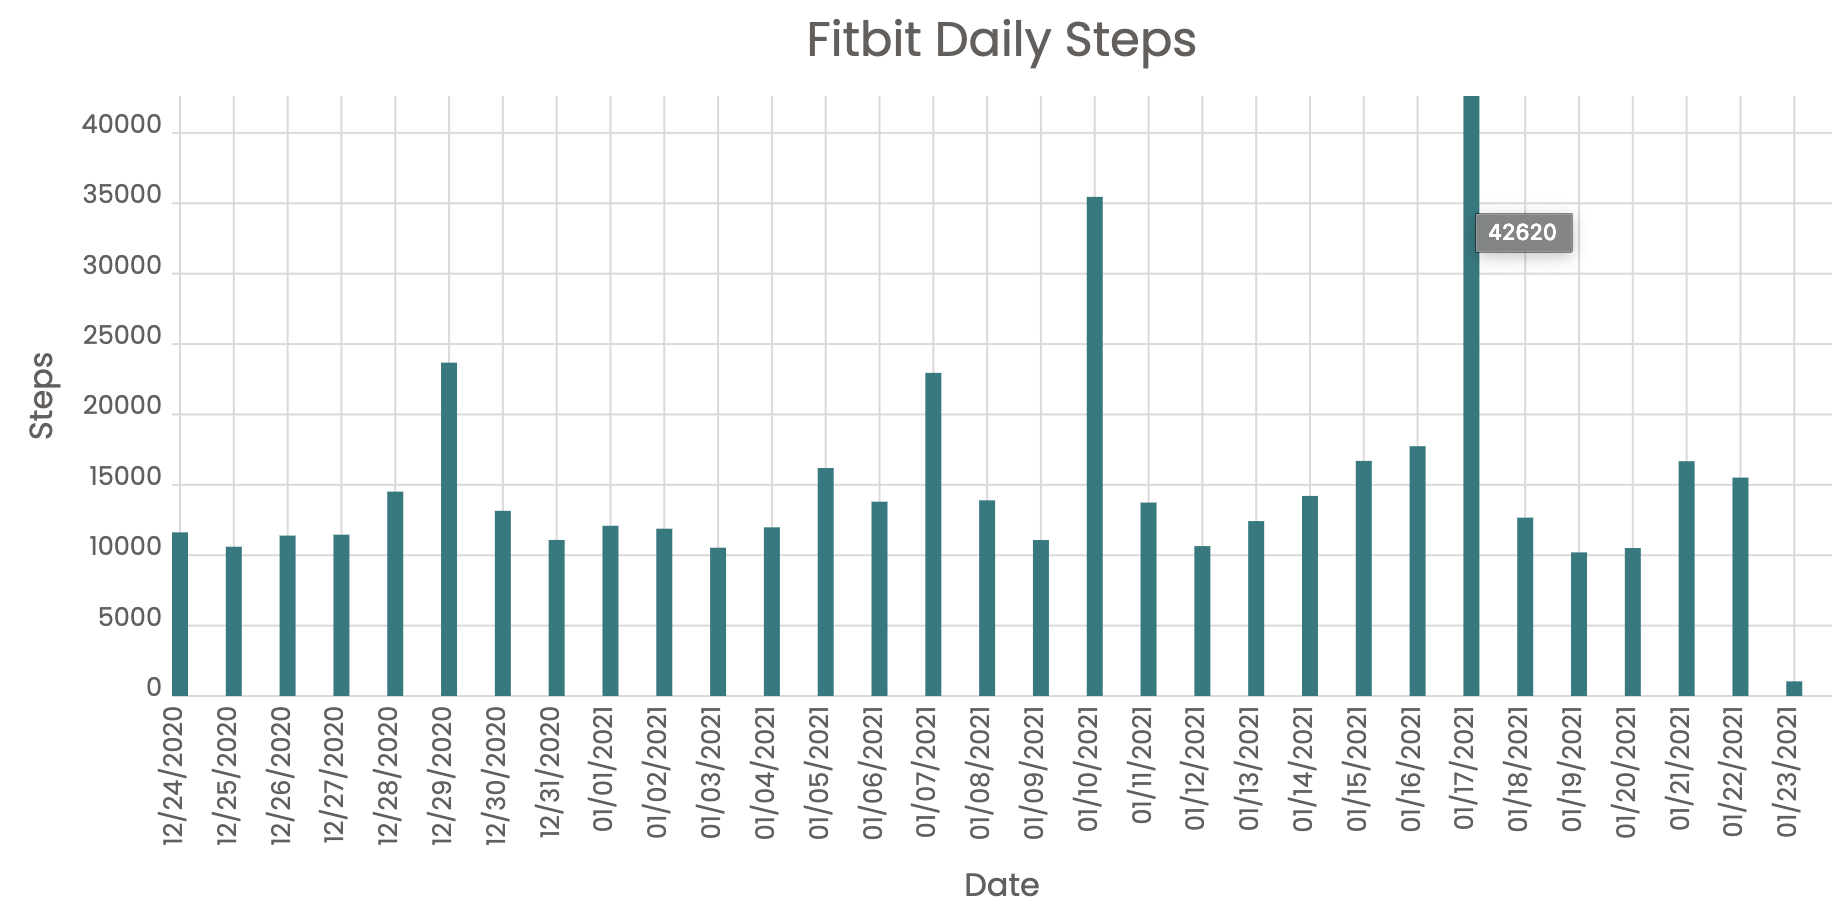
As Curran has built a chart for the number of COVID-19 cases in Datavis 2020, there is a direct relationship between data visualization and real-world circumstance. It means that data visualization has a huge potential to change our lives.
1. In fact, Datavis 2020 is also going to be outdated since D3 v6 has been released in the middle of the year. ↩
Support
Gift a cup of coffeeCategories
See also
- March 13, 2021
- How Much CO2 Emissions Have Your Flights Made?
- February 3, 2021
- Practicing D3 Interactive Data Visualization with Fitbit Activity/Sleep Log
- April 11, 2020
- What Makes a Good Dashboard: The Rise of Augmented Analytics
Author: Takuya Kitazawa
I am a product builder, mentor, and advocate for sustainable technology development with a decade of experience in AI/ML products, data systems, and digital transformation. Based in Canada and originally from Japan, I have lived and worked globally, including part-time residence in Malawi, Africa. Visit my portfolio to learn more about my work, or reach out to me at [email protected].
NowDisclaimer
- Opinions are my own and do not represent the views of organizations I am/was belonging to.
- I use Grammarly for correcting grammatical errors, but I do not rely on any other generative AI tools to create my blog content.
- I am doing my best to ensure the accuracy and fair use of the information. However, there might be some errors, outdated information, or biased subjective statements due to the nature of a personal website. Visitors understand the limitations and rely on any information at their own risk.
- If there are any issues with the content, please contact me so I can take the necessary action.