After deepening my knowledge about Supply Chain Management, I became particularly curious about how data helps supply chain management. Here, another course Supply Chain Analytics illustrated a realistic example of VASTA, one of the largest mobile network careers in the US (Verizon, AT&T, Sprint, T-Mobile), which made a big change in their distribution strategy as a consequence of supply chain analytics.
A list below is a step-by-step guide to using data for supply chain optimization:
- Opportunity identification
- Intuition & insight development
- Data analytics to confirm the intuition
- Implementation without sacrificing customer satisfaction
Notice that actual analytics work is a limited part of the entire process. As many best practices for data science explain, understanding the domain well, making a better hypothesis, and planning a direction that makes sense to you are the crucial steps to undergo. Plus, the final implementation work happens in the real world (not on your Jupyter notebook!), and hence we shouldn't forget to be considerate of what the data doesn't explicitly tell.
Opportunity identification
First of all, we understand an overview of an industry, product, and current revenue source.
In the case of VASTA, domain knowledge about the telecommunication industry is needed, and we'd like to capture a competitive landscape among the other players. Eventually, we could identify our strengths and weakness relative to the competitors, and the weakness can be an opportunity for improvement.
An identified opportunity for VASTA was the inefficiency in push-based distribution strategy. From three distribution centers (DCs) in the US, they had regularly shipped their product (cellphones) to more than 2000 physical stores; VASTA is a traditional telco company in the country, and the strategy worked well for a long time. However, as the product lifecycle of mobile phones becomes shorter these days, it has become difficult for individual stores to sell out their inventory as planned. Consequently, their logistics and inventory cost were piled up.
Note that 8.93% of total GDP in the US is associated with logistics cost, according to the course, and the fact indicates how distribution strategy plays an important role to efficiently operate a business that relies on a physical product.
Moreover, high-quality service and customer satisfaction must be achieved while reducing the cost. For instance, we can easily reduce the logistics and inventory cost by simply decreasing the volume of shipments from DCs, but what will happen if the modified plan causes a shortage of in-store stock?
Based on all of the background knowledge above, VASTA ultimately considered shifting its push-based distribution strategy to a pull-based strategy. Unlike push strategy that ships products to stores and sells at the onsite locations, a pull strategy is a demand-based approach that compiles a product on-demand and directly sends it out from DC to a customer; the role of physical stores in the pull strategy is like a "showroom".
Intuition: What are drivers and trade-offs in the supply chain?
Once the problem to solve and potential solution are identified, we'll try to have a better understanding of an end-to-end process and compares the trade-offs on a factual basis.
An entire supply chain can be simplified as follows:
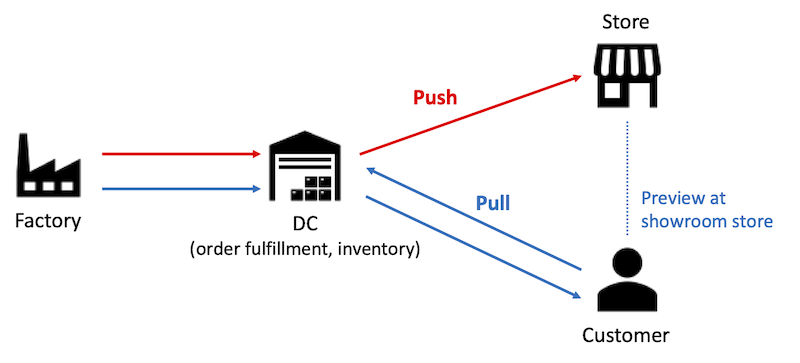
First, inventory at warehouses is a key piece to balance supply and demand. On one hand, inventory enables companies to economically store a huge amount of products at a lower price in a scalable manner. On the other hand, if market speed doesn't match the warehousing strategy and there are remaining stocks when a new product is introduced, the company has to "wait" until all inventories are sold.
Secondly, different products require to have different distribution strategies. To give an example, for an expensive product such as cars, computers, and mobile phones, batch and infrequent replenishment via truckload should work sufficiently. Meanwhile, fresh items sold at grocery stores (e.g., vegetables, flowers) need to be continuously replenished via a less-than-truckload.
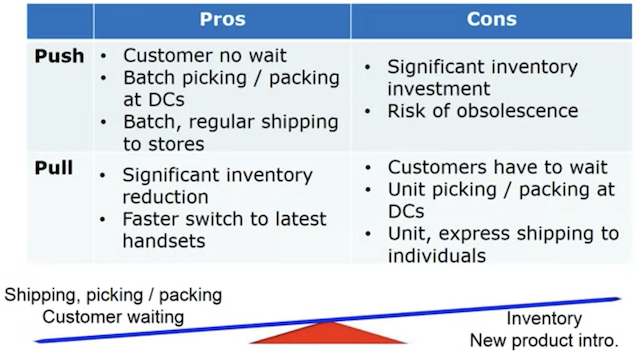
Therefore, an intuition of push-pull strategy can be summarized as follows:
- The right option depends on product type in terms of price, popularity, moving frequency.
- Push strategy works well for low value AND fast-moving items.
- Pull strategy is suitable for high value OR slow-moving products.
- Pull strategy makes factory-to-customer direct shipping possible while minimizing inventory.
Quantitative supply chain analytics
We then quantify the push vs. pull strategy to confirm the intuition and find out the best option to take.
On either Excel spreadsheet or your preferred programming tool, inventory holding, shipping, picking/packing, sales volume cost can be collected, calculated, and compared as follows:
- Inventory holding cost at stores:
- Inventory cost per week per unit
- = Capital cost per week per unit + Deprecation per week per unit
- = (annual capital cost / 52 weeks) + ((product value - liquidation value) / (product lifecycle))
- Shipping cost per unit
- Push strategy: Batch shipping; volume discount rate can be applied, and it enables us to save $2.4 per unit in the case of FedEx.
- Pull strategy: A flat rate per unit (e.g., $12 at FedEx) is applied for every direct shipment.
- Picking/packing cost at DCs
- Assume the first pick/pack costs $1.
- Push strategy: Subsequent picking/packing can be done at a lower price (e.g., $0.1) because a product is already located and the machine is ready for batch operations.
- Pull strategy: The first-time factor is equally applied to all subsequent shipments, and it'll be more expensive than push.
- Sales volume cost
- Slow-moving products are hard to predict demand, and sales volume varies.
Finally, we see a consequence that the pull strategy is characterized by (1) significant inventory saving and (2) an increase in shipping & picking/packing. That is, the net impact becomes positive only if (1) >>> (2).
Bottom line: Analytics led VASTA to the right strategy
Although none of the mathematical tools above were complicated, we could have a clear view of VASTA's distribution strategy thanks to the step-by-step process starting from a solid hypothetical question: Which does push vs. pull strategy work better for VASTA?
To the end, the following outcomes can be obtained, and VASTA could take action that changes their push-based strategy to a pull-based one considering the characteristics of today's mobile phone market & product.
* Captured from Supply Chain Analytics on Coursera.
A key takeaway from the exercise is that actionable insights cannot be obtained without having a clear understanding and assumption of your problem. In other words, if you come up with a good factual insight that the data doesn't tell, data analytics allows you to quantitatively validate them and confidently take an action.
Support
Gift a cup of coffeeCategories
Data & Algorithms Society & Business
See also
- November 12, 2021
- What Container and JIT Mean for Today's Supply Chain Disruption
- April 4, 2021
- The Essence of Supply Chain Management
- August 29, 2020
- What I Think About When I Talk About ML Product
Author: Takuya Kitazawa
I am a product builder, mentor, and advocate for sustainable technology development with a decade of experience in AI/ML products, data systems, and digital transformation. Based in Canada and originally from Japan, I have lived and worked globally, including part-time residence in Malawi, Africa. Visit my portfolio to learn more about my work, or reach out to me at [email protected].
NowDisclaimer
- Opinions are my own and do not represent the views of organizations I am/was belonging to.
- I use Grammarly for correcting grammatical errors, but I do not rely on any other generative AI tools to create my blog content.
- I am doing my best to ensure the accuracy and fair use of the information. However, there might be some errors, outdated information, or biased subjective statements due to the nature of a personal website. Visitors understand the limitations and rely on any information at their own risk.
- If there are any issues with the content, please contact me so I can take the necessary action.